1. Introduction
2. Analyse Item Sold Analysis Report
1. Introduction
Item Sold Analysis Report allows you to track and analyse the performance of individual products sold over a specific sales channel and time period. This report helps you to determine which products are selling well, and which ones aren’t across the sales channel.
📌Note: Make sure your products in sales channels are linked with inventory items to ensure the accuracy of the report.
2. Analyse Item Sold Analysis Report
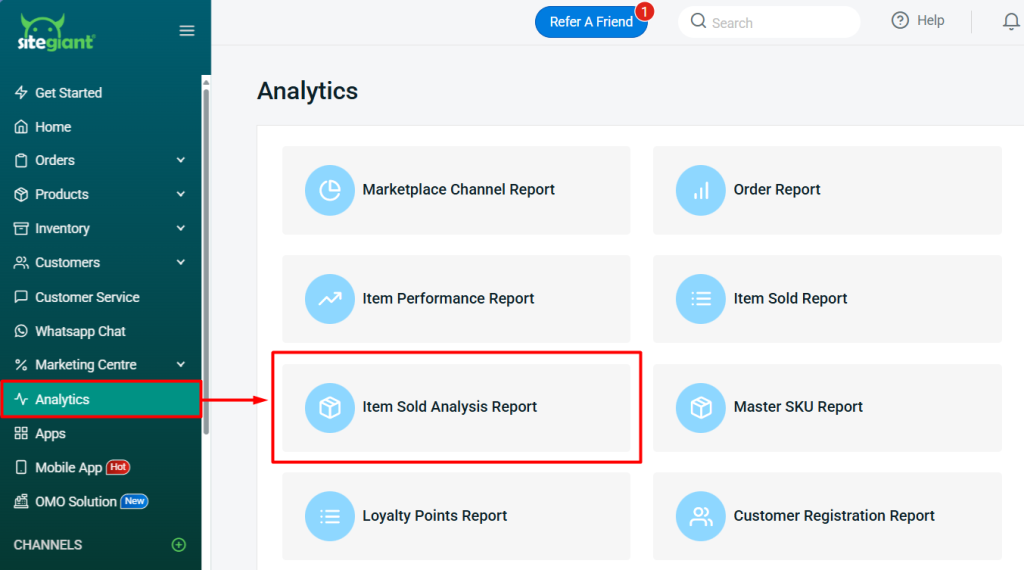
Step 1: Navigate to Analytics on the sidebar menu > Item Sold Analysis Report.
Step 2: Filter the Sales Channel and Stores, then search the Date Period to analyse the report.
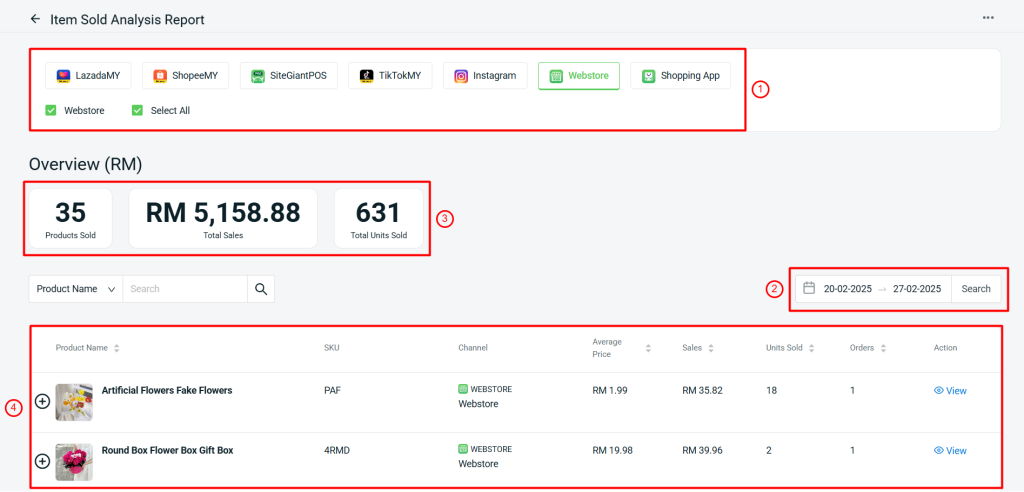
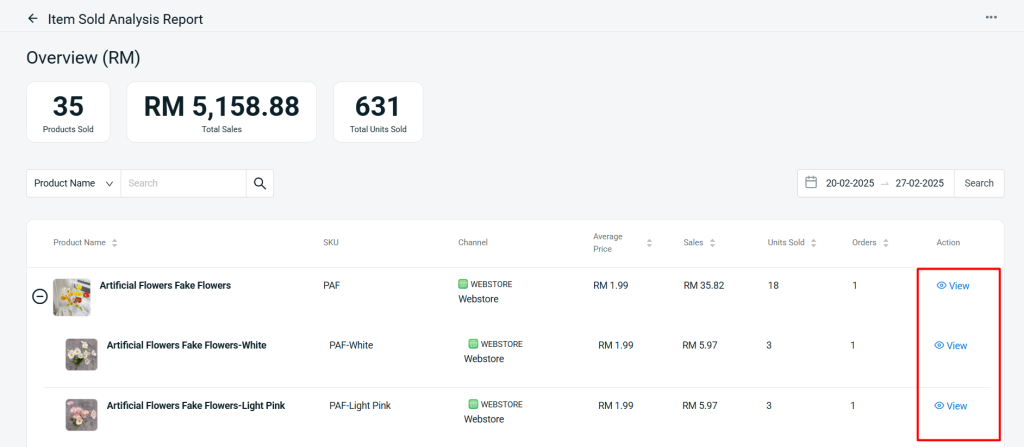
1. Sales Channel: Choose one sales channel to view the stores' sales performance under the selected sales channel.

2. Date Period: Set the date range of the report. The maximum date range to be filtered is up to 3 months.

3. Overview: Show the Products Sold, Total Sales, and Total Units Sold of the selected sales channel and date period.

4. Product Report: Show the sales performance details of the products from the selected sales channel.
Step 3: Click the (+) button to view the sales performances by the products variants.
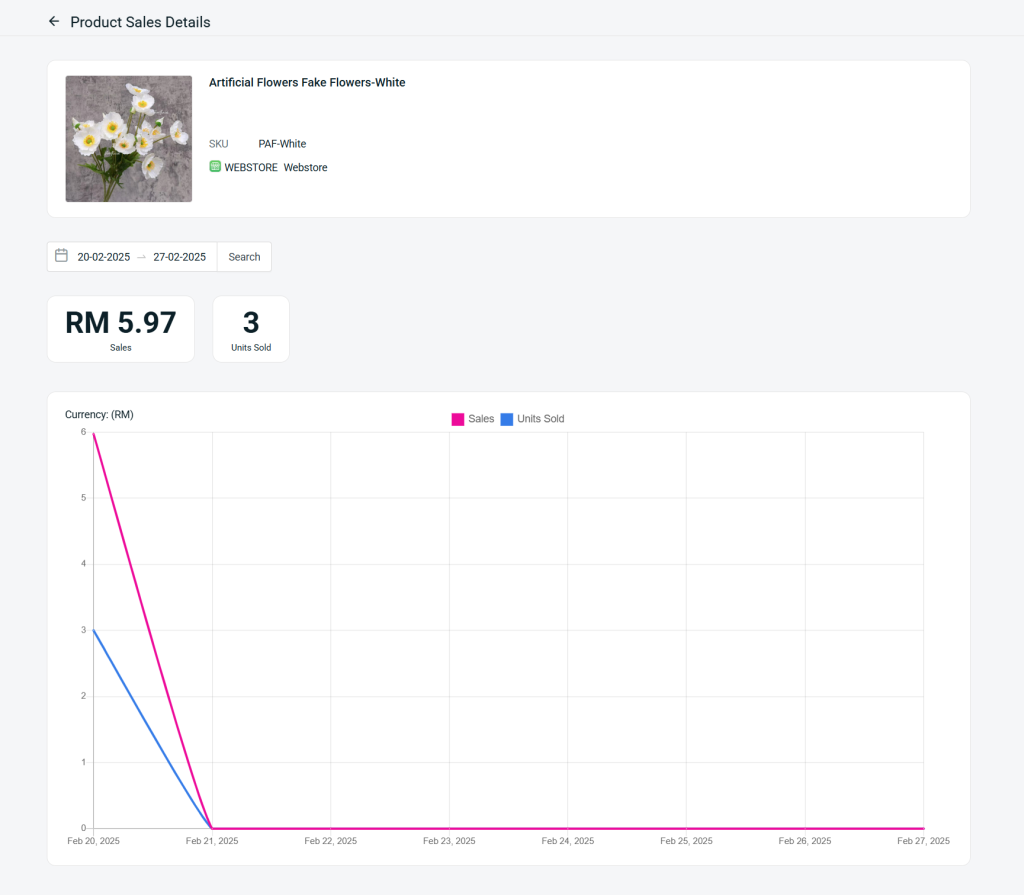
Step 4: Click View to go into Product Sales Details to analyse the sales performance for that specific product.
Step 5: The Sales and Units Sold will be shown in the form of graphs so that you can easily analyse the sales trend.