1. Introduction
2. RFM Settings
3. RFM Analysis
4. Recent Purchase Report
5. Purchase Frequency Report
6. Spending Amount Report
1. Introduction
The RFM Report provides a comprehensive overview of your customer base by identifying which segments bring the most value and which require more attention. By analyzing customer behavior through Recency, Frequency, and Monetary (RFM) metrics, you can gain valuable insights to design more effective marketing strategies that enhance customer engagement and drive sales growth.
This feature is only available in SiteGiant OMO Pro and above, as well as the SiteGiant ERP Add-On App.
2. RFM Settings
Step 1: Navigate to Apps on the sidebar menu > click Add-On > RFM Report.

Step 2: Click the Gear Icon button.

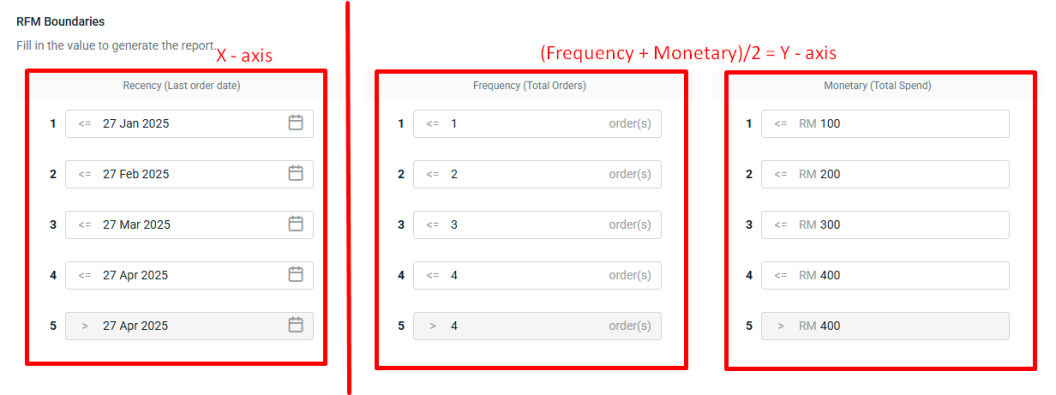
Step 3: Fill in the values for Recency, Frequency, and Monetary to generate the report. Each category will be segmented into 5 levels, from Level 1 (lowest) to Level 5 (highest).
📌Note: Adjust these values based on your business context.
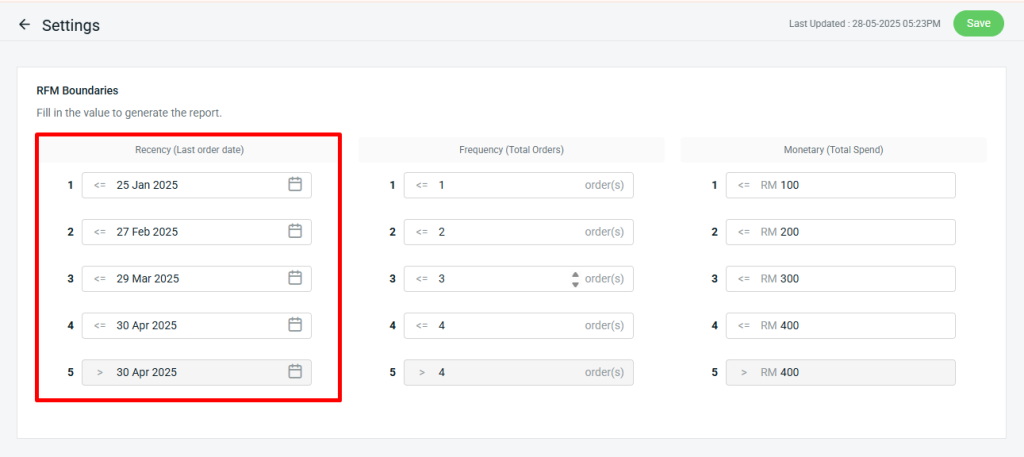
I. Recency (Last Order Date)
Recency measures how recently a customer made a purchase. The more recent the purchase, the higher the recency score.
Step 1: Fill in the date ranges to indicate how recently the customer placed their last order.
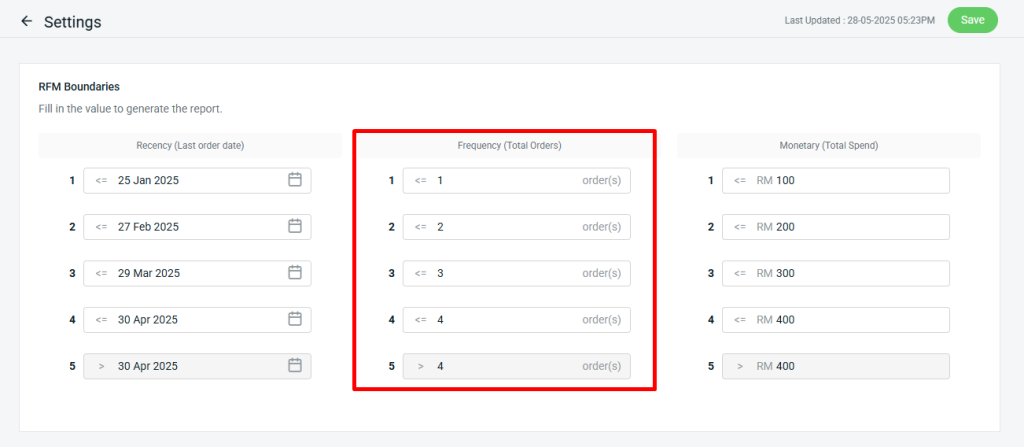
II. Frequency (Total Orders)
Frequency indicates how often a customer makes purchases. More frequent orders suggest higher engagement and loyalty, leading to a higher frequency score.
Step 1: Enter the number of orders that qualify for each level.
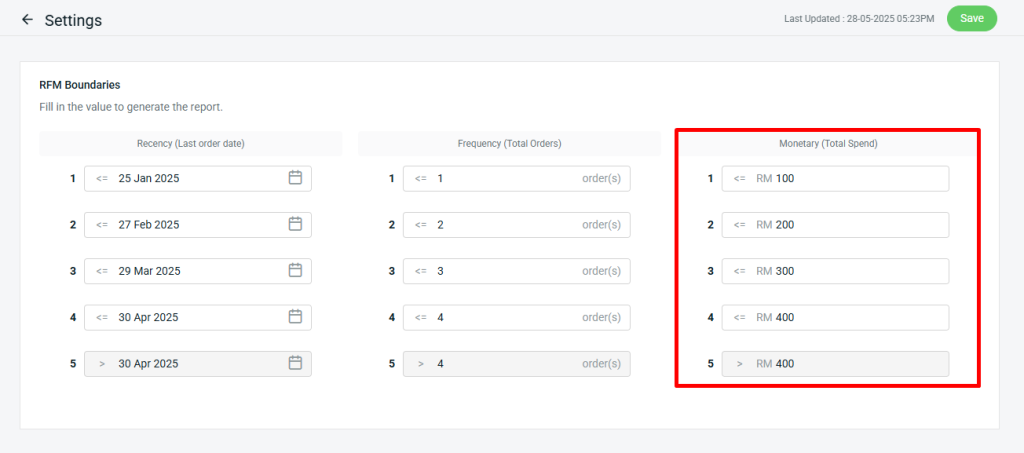
III. Monetary (Total Spend)
Monetary reflects the total amount a customer has spent. Customers who spend more receive higher monetary scores, making them more valuable to your business.
Step 1: Enter spending thresholds for each level.
3. RFM Analysis
Step 1: You may refer to the RFM Analysis Report, which automatically groups your customers into RFM Customer Segments based on key behaviors, Recency, Frequency, and Monetary Value, according to the scoring criteria you’ve defined in the settings.
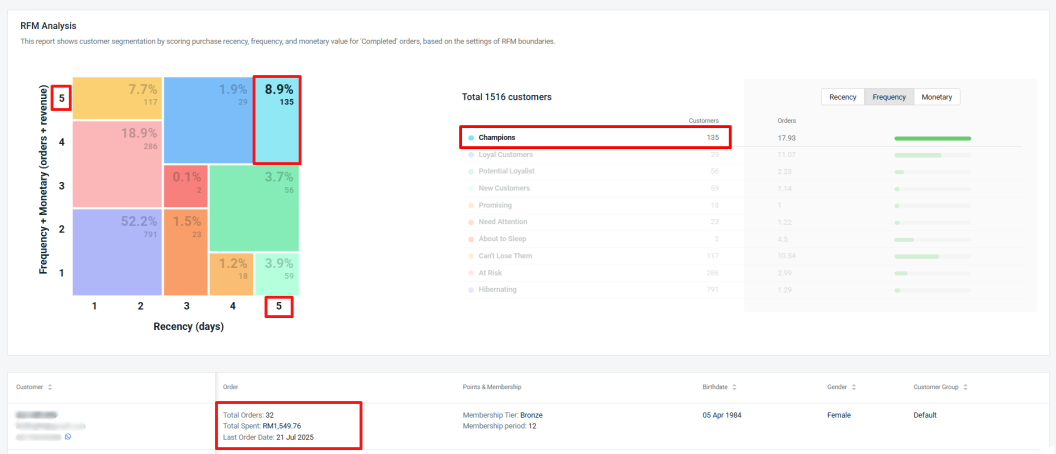
Calculation of the RFM Customer Segments:

Based on the image above, the customer details are shown as follows:

Last order date: 21 July 2025 → Recency score = 5
Total orders: 32 → Frequency score = 5
Total spent: RM1,549.76 → Monetary score = 5

So, the customer’s position on the chart will be:

X-axis: 5 (Recency)
Y-axis: (5 + 5) / 2 = 5 (Frequency + Monetary)

Therefore, Customer will appear in the top-right corner (Champions) of the RFM grid, indicating a highly valuable and recently active customer.
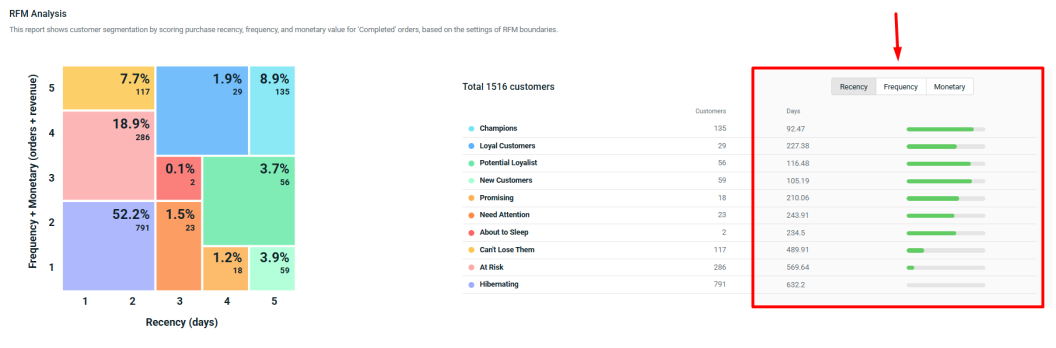
Step 2: From the right corner, you can also view the total Recency, Frequency, and Monetary scores based on the RFM Customer Segments criteria. This allows you to identify which customers to reward or follow up with to boost your website sales.
4. Recent Purchase Report
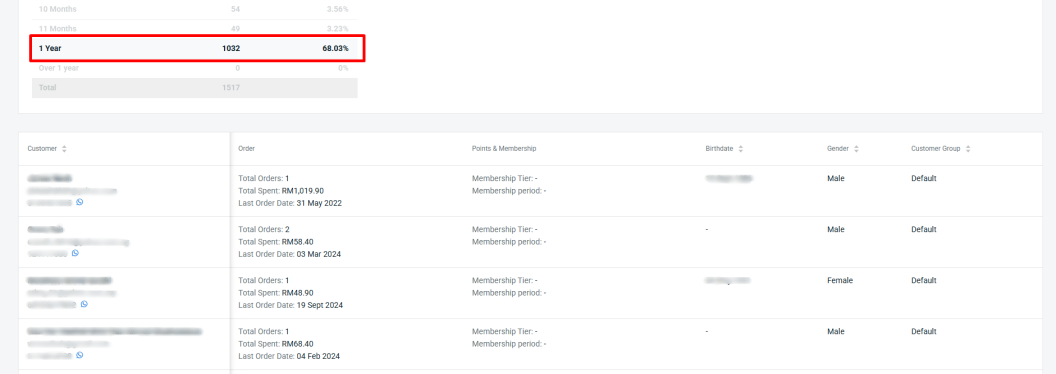
Step 1: The Recent Purchase Report displays the orders placed by recently registered customers. It provides a detailed breakdown of the time since each customer’s last transaction.
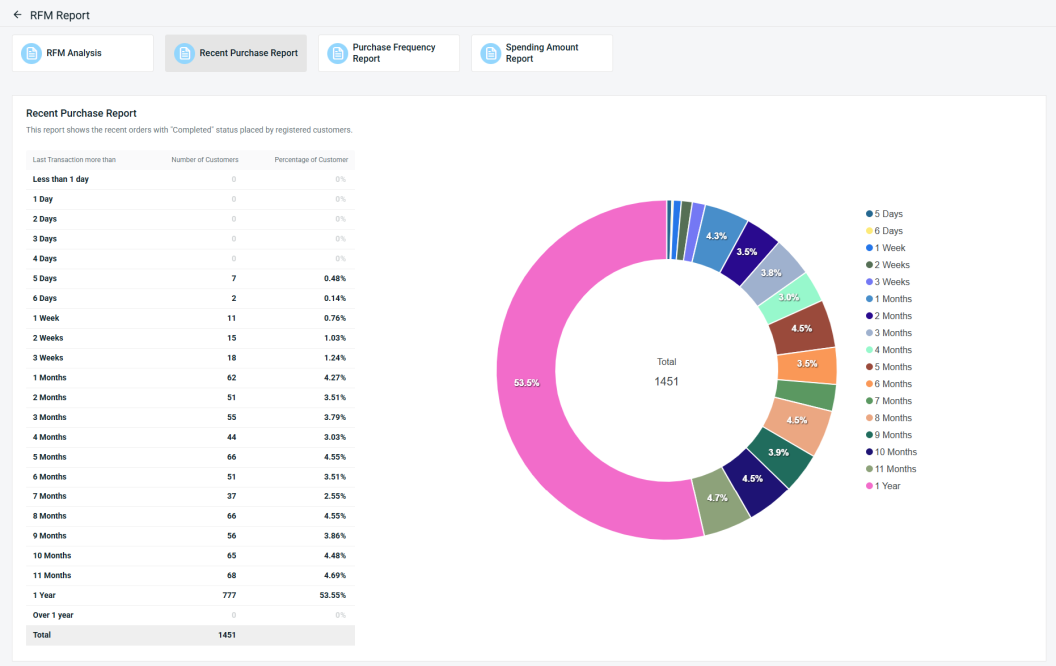
📌Note: This report only displays data based on customers’ completed orders.
Step 2: Click on the related transaction to view the customer details based on the breakdown of their last transaction.
5. Purchase Frequency Report
Step 1: This report shows the total number of orders placed by registered customers, helping you understand how frequently your customers purchase.
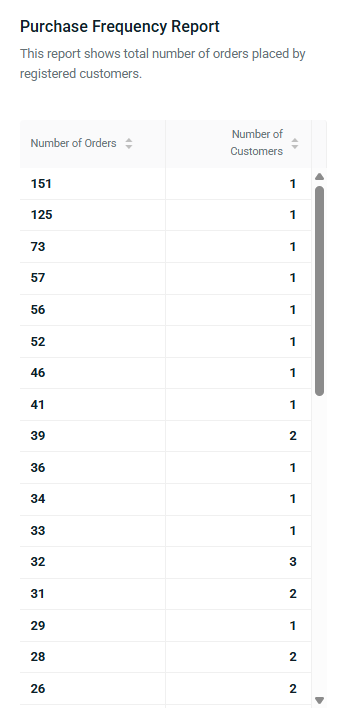
Step 2: You can click on the Purchase Frequency Report listing to view the related customer details.

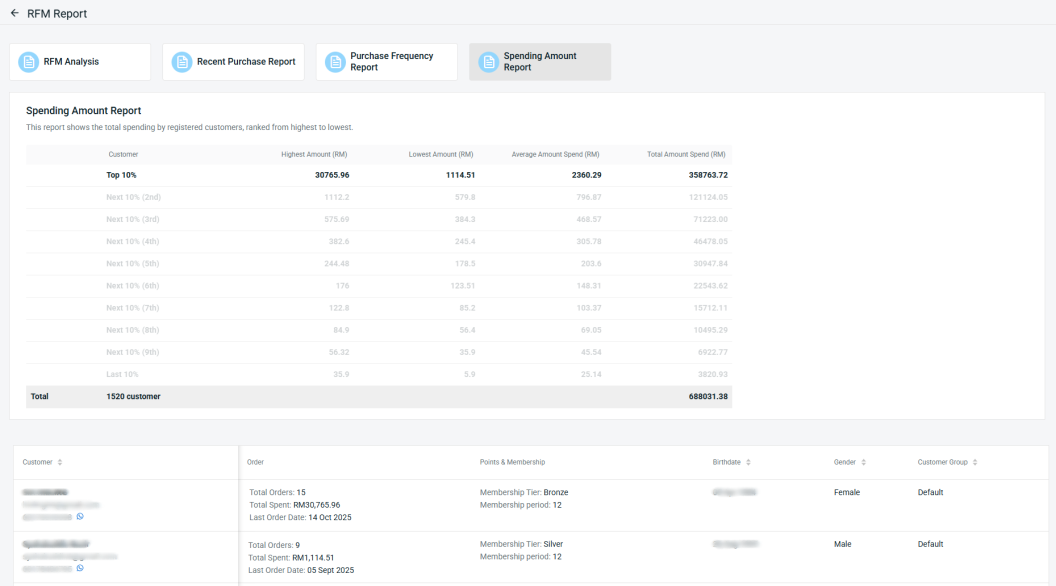
6. Spending Amount Report
Step 1: This report shows how much your registered customers have spent, grouped by spending levels from highest to lowest.

Step 2: You can click on the ranking to view the customer details with the highest and lowest purchase amounts.