1. Introduction
2. Analyse Item Performance Report
1. Introduction
This Item Performace Report allows you to compare and analyse your item sales performance between two different periods of time. Hence, you can know the sales trend of your product in each channel and eventually can perform forecasting and marketing for better sales results.
?Note: Make sure your products in sales channels are linked with inventory items to ensure the accuracy of the report
2. Analyse Item Performance Report
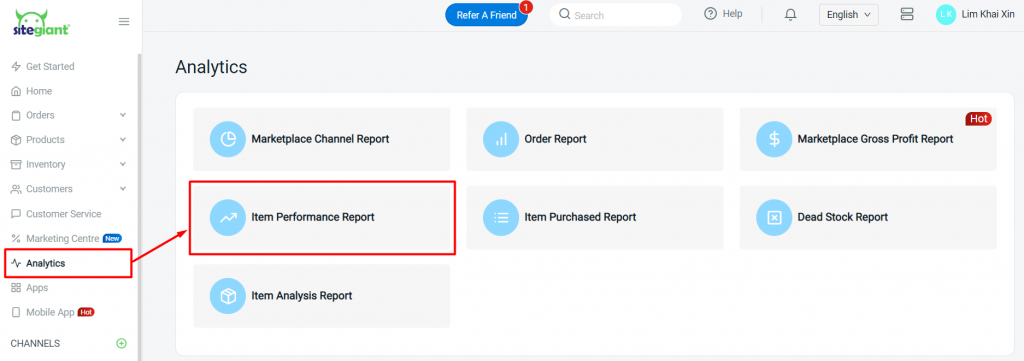
Step 1: Navigate to Analytics on the dashboard menu > choose Item Performance Report

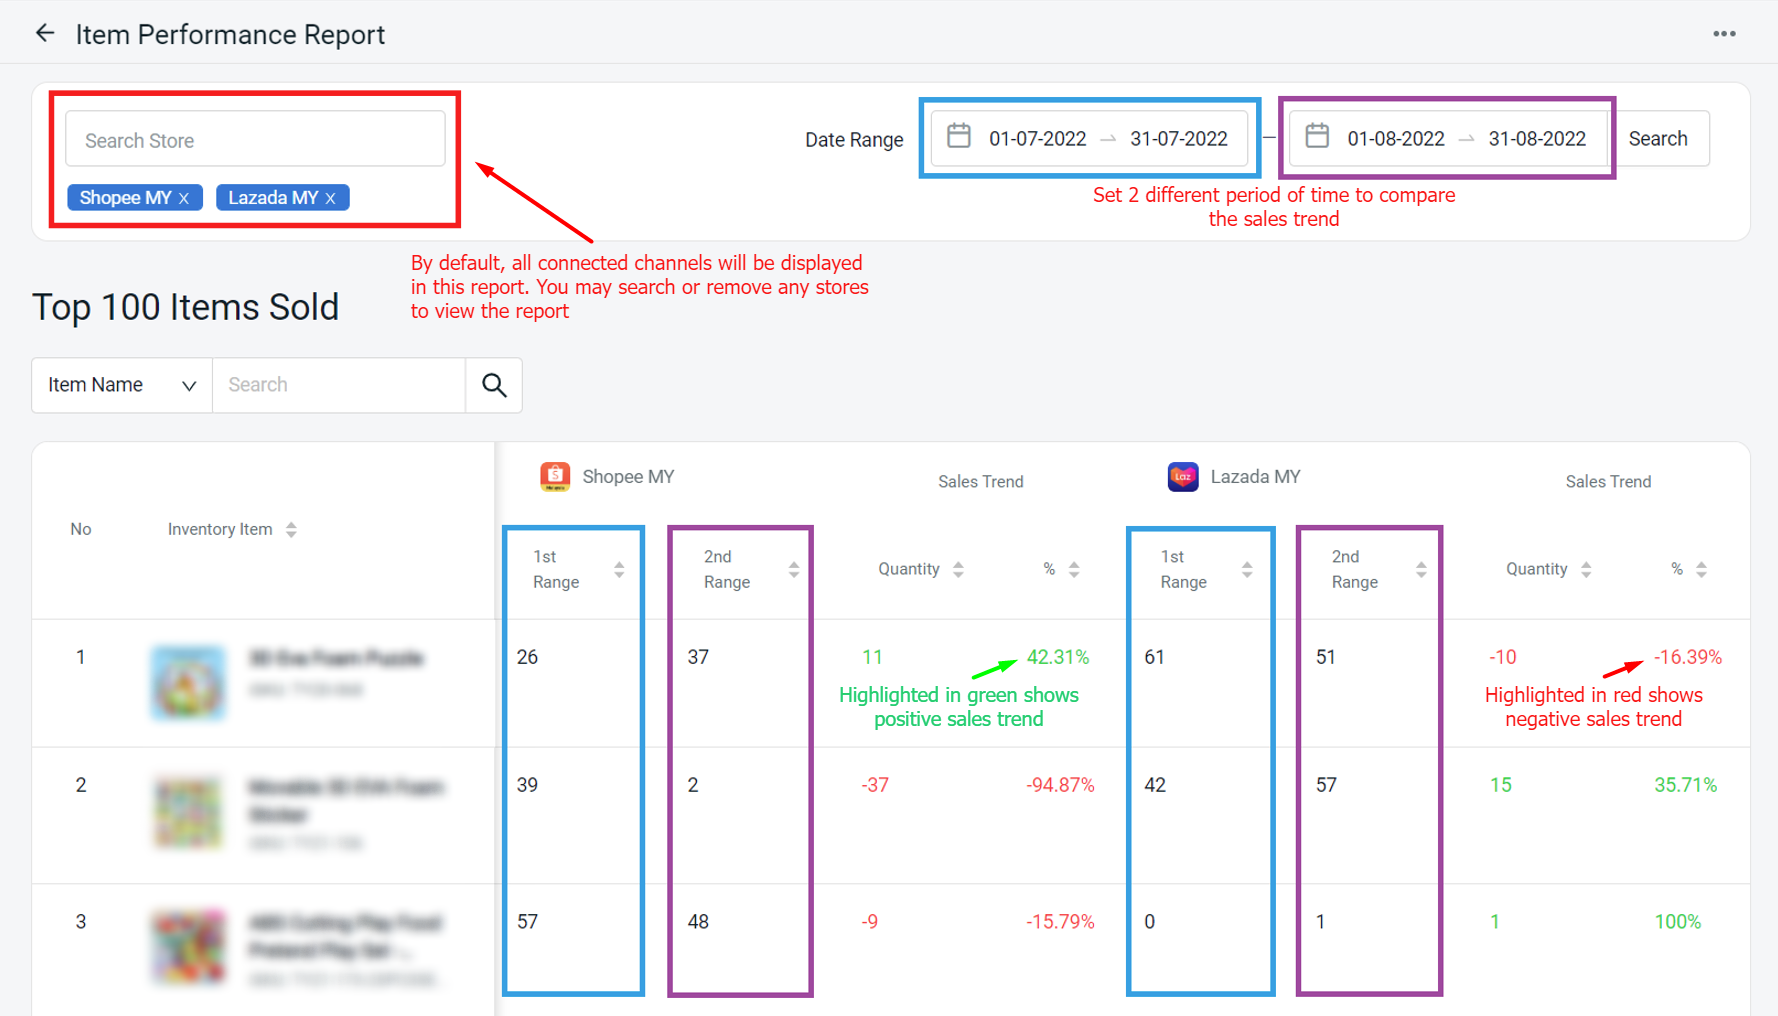
Step 2: You’ll be able to view and analyse the sales trend of your top 100 items which has been sold between the two date range that you set

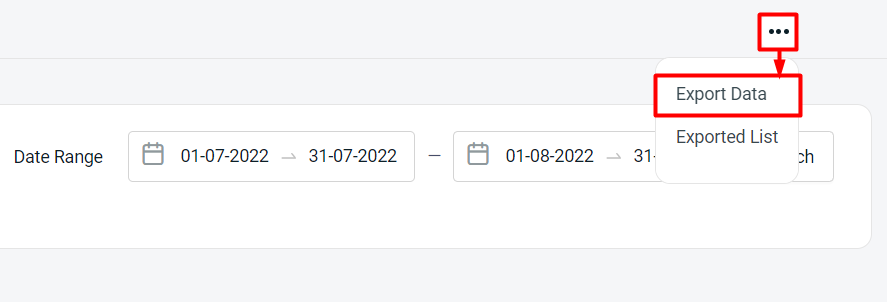
Step 3: You may also export the report by clicking on More (…) > Export Data

